
Must Try AI Tools for Data Visualization in 2024
Data visualization represents data in the form of graphs and charts. The data scattered across the internet is raw, unstructured, and complex. For businesses, it’s essential to understand the raw information to draw valuable insights.
These insights help in understanding the audience and potential customers. Thus, to gain such insights from complex data, presenting them as charts and graphs is useful. Such visualization helps in making informed and better decisions.
With the advances in technology and AI, data visualization methods are easier to use. There are tons of AI tools for data visualization that will make the process easy. You can use such tools to improve your workflow and learn more. These tools help businesses, researchers, science, and many data-driven fields.
What are AI Data Visualization Tools?
Data visualization is a technique used to represent raw data in a visually appealing and understandable form. Now, with AI, data visualization has converted to higher scales.
AI Visualization tools are software that uses AI to improve the visualization process. Using AI tools for data visualization can automate the creation and interpretation of visual representations of data.
Top AI Tools For Data Visualization
1. Tableau
Tableau AI is like an intelligent assistant for data experts, making their work easier. It helps them understand data and create excellent visuals faster. Einstein Copilot guides them through tasks and boosts the quality of graphs and dashboards. It keeps everything safe and fair with its Einstein Trust Layer.
Tableau AI helps everyone in a business by giving personalized insights. It’s like a customized data butler serving the correct information at the right time. Data Stories and Einstein Discovery makes it easier to explain data, explore ideas, and get intelligent suggestions.
Key Features
- Einstein Copilot : It helps users through tasks and improves the quality of visualizations.
- Einstein Trust Layer : It ensures all AI insights are secure and ethical.
- Personalized Insights : Provides all users within a business with intelligent and tailored insights.
- Explain Data : It offers plain-language explanations and trustworthy predictions.
User-Specific Benefits
Automate insights with Einstein Copilot and secure data with Einstein Trust Layer. Create visuals faster and get personalized, actionable insights for your team.
Pros
- It improves productivity by reducing repetitive tasks.
- The tool automates data analysis, preparation, and governance.
- It also provides contextual guidance for improved visualization.
- It ensures secure and ethical AI-powered insights.
Cons
- Needs adaptation time to AI functions.
- Effectiveness depends on quality data.
Pricing
Tableau offers three pricing plans starting from $75 per month.
2. Power BI
Microsoft’s Power BI is an efficient data visualization tool. It allows you to turn your data into interactive visuals using data analysis tools. It also has AI powers and a user-friendly report-creation tool.
You can create datasets from any source and add them to the OneLake data hub to develop a source of truth for your data. Power BI makes it easy to embed and share reports in other Microsoft services such as Teams, PowerPoint, Excel, and Power Platform. You can also find patterns in data, create reports, and get answers to your queries.
The Copilot helps create reports by describing what you want or asking questions about your data. You can add insightful text summaries to help you understand your data and tailor your narratives’ tone, scope, and style. You can also create DAX calculations faster by asking Copilot in Power BI to suggest relevant code and entire functions.
Key Features
- Data Visualization : Allows efficient visualization using data analysis tools.
- Insights : Integrated AI insights to identify patterns, generate instant reports, and answer questions.
- Report Creation : It offers a user-friendly tool for creating reports.
- Data Integration : Enables the creation of datasets from various sources.
- AI Copilot : Aids in creating reports by interpreting descriptions. It also answers questions related to data.
User-Specific Benefits
Turn your data into interactive reports. Use AI Copilot to simplify report creation and spot patterns quickly. Integrate easily with Microsoft services for smooth workflows.
Pros
- Advanced data analysis powers.
- Integration of AI-powered insights.
- User-friendly creation of the report.
- Easy embedding and sharing.
Cons
- Beginners might need help navigating the tool’s functionality.
Pricing
Microsoft’s Power BI offers pricing plans starting from $10.00 per mon
3. Sisense
Sisense’s Fusion Analytics Platform is a powerful data visualization tool. Using this tool, businesses can make smarter decisions and engage customers. It uses smart AI analytics for advanced insights from various data sources.
It offers two integration methods. One is an easy-to-use application for non-coders. The second one is a more flexible approach with SDKs and APIs for developers. You can integrate analytics into the interface and development workflow. This allows users to see enhanced analytics using charts and graphs. You can ask questions in plain language and receive AI-generated answers.
Developers can use the Sisense Compose SDK to include analytics in the code. This is a cloud-based platform that offers easy maintenance. It works well in different cloud environments and can adapt to different scales. You can create analytics without code or with low code and share insights using different visual tools.
Key Features
- Data Analytics : Allows extraction of valuable insights from different data sources.
- Data Visualization : It offers effective visualization of data through charts and graphs. This makes more data accessible and understandable.
- Cloud-Based : Offers cloud-based accessibility, ensuring easy maintenance.
- No/Low Code Analytics : Allows the creation of analytics without extensive coding.
User-Specific Benefits
Integrate analytics with or without code. Gain clear insights with AI-driven analytics and customize data visualizations to meet your needs.
Pros
- Uses AI analytics for better insights.
- It provides integration options for both non-coders and developers.
- It provides clear and improved data representation.
- The tool is highly customizable, providing flexibility.
Cons
- It needs extra data information to use advanced features.
- Some technical knowledge is needed to use customization features.
Pricing
Contact for pricing
3. Data Wrapper
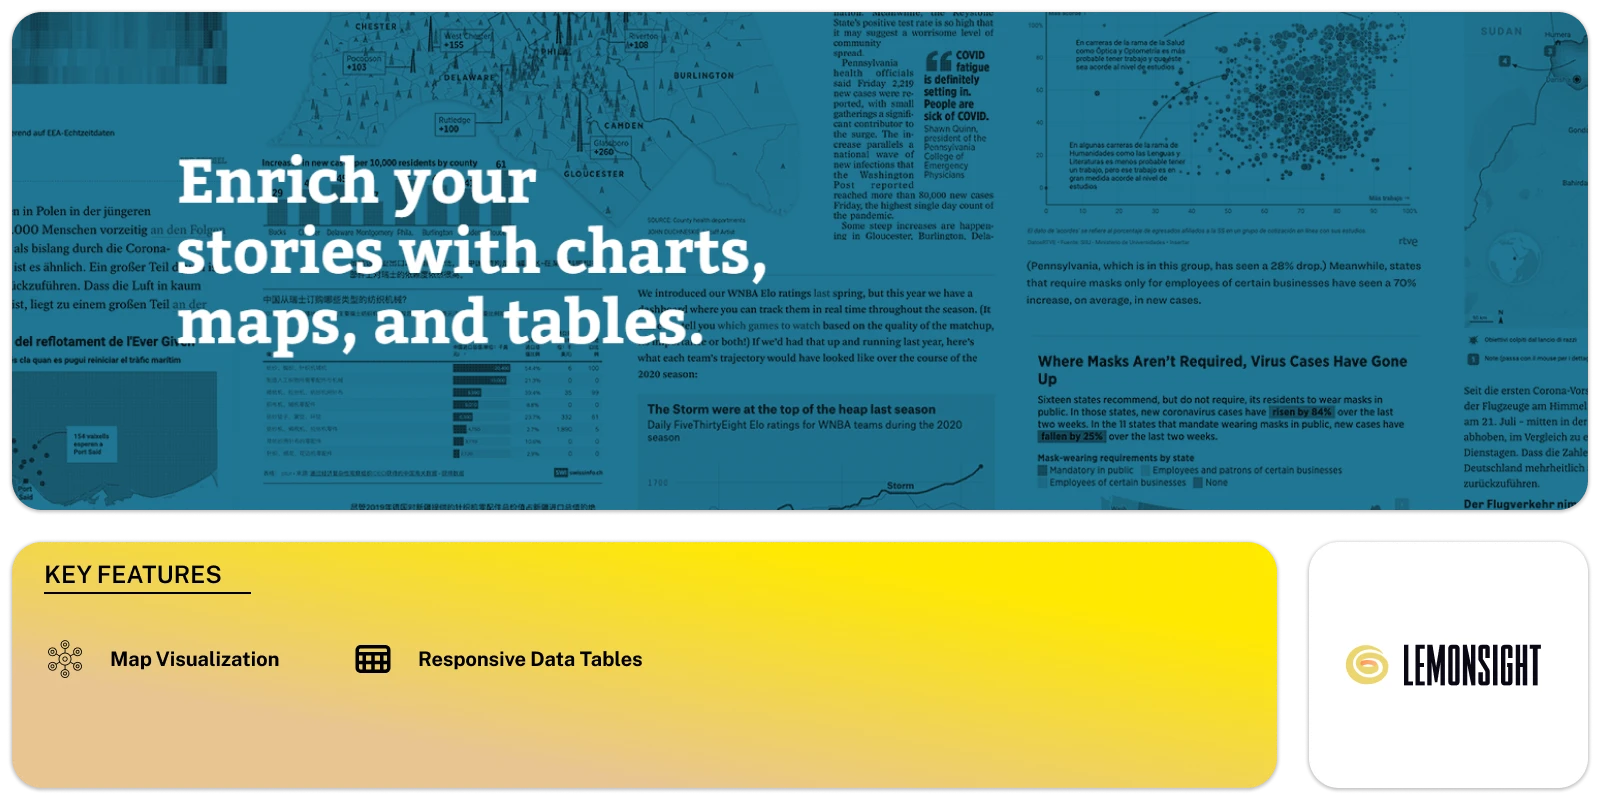
Datawrapper is a visualization tool for creating charts, maps, and tables. It offers 19 interactive and responsive chart types, from simple bars and lines to arrow, range, and scatter plots. The tool also provides three interactive and responsive map types for creating everything from locator maps to thematic chord and symbol maps.
Its responsive data tables allow for lots of styling options. It lets you include a bar, column & line charts, heatmaps, images, a search bar, and pagination. You can copy your data from the web, Excel, or Google Sheets. You can also upload CSV/XLS files or link to a URL or Google Sheet for live-updating charts. It allows you to copy the responsive embed code into your CMS or website to show the interactive chart or export it as a PNG, SVG, or PDF for printing.
Key Features
- Charts : Offers 19 interactive chart types, from bars and lines to scatter and range plots.
- Map Visualization : It provides three interactive map types, including choropleth and symbol maps.
- Data Tables : Allows vast styling options and includes charts, images, and search options.
- Data Input Options : Enables data input via web copy, Excel, Google Sheets, CSV/XLS file upload, or URL linking.
- Embedding : Allows responsive embedding into CMS or websites and export options in PNG, SVG, or PDF formats.
User-Specific Benefits
Create diverse charts, maps, and tables effortlessly. Use multiple data input options and embed interactive visuals on your site with ease.
Pros
- It offers a wide variety of chart types and maps.
- The tool provides different styling options for data tables.
- It offers many data input sources.
Cons
- Limited customization for advanced users.
- Some features may need a paid subscription.
Pricing
Datawrapper is free and offers paid plans starting from $599 per month.
5. HiPlot
HiPlot by Meta is a visualization tool designed especially for AI researchers who work with complex, high-dimensional data. Its main purpose is to help researchers discover correlations and patterns within their datasets. Thus providing a better understanding of data nuances.
It is also available as a Python library, which users can install easily. It supports both 2D and 3D plotting and provides a variety of plot types, including line plots, scatter plots, and surface plots.
You can also use different color schemes, focus on certain ranges, and more in your charts & graphs. The tool also supports CSV or JSON file parsing and custom Python parsers. HiPlot is user-friendly and can be integrated into IPython notebooks or servers
Key Features
- Data Visualization : Effective visualization features for complex and high-dimensional data.
- Python Library : It is available as a Python library and can be installed using a command.
- 2D and 3D Plotting : It supports both 2D and 3D plotting for different visualization needs.
- Data Parsing : Supports CSV or JSON file parsing along with the use of custom Python parsers.
User-Specific Benefits
Visualize complex data with 2D and 3D plots. Use its Python library for custom analyses and get clear views of high-dimensional datasets.
Pros
- It deals with complex and high-dimensional data.
- It offers various plot types.
Enables easy customization of visualizations. - Allows for extendability and parsing support.
Cons
- It may have limited abilities for large datasets.
Pricing
Hiplot is free to use
6. Looker Studio
Google’s Looker Studio is a powerful tool for visualizing and reporting data. It is part of the Google Workspace suite of tools and enables users to create interactive dashboards and reports with their data. It works with other Google products like Google Sheets, BigQuery, and Google Analytics.
With Data Studio, users can connect to their data sources, create custom charts and tables, and share their dashboards using a secure web link. Additionally, it offers pre-built templates and connectors to popular data sources.
Key Features
- Data Visualization : Enables the creation of interactive and customizable dashboards for data visualization.
- Integration : It allows integration with Google’s suite of tools like Google Sheets and Google Analytics.
- Data Connection : Allows easy connection to data sources and the creation of custom charts and tables.
- Customization : Offers pre-built templates and connectors for various data sources.
User-Specific Benefits
Build interactive dashboards and reports easily. Integrate seamlessly with Google tools and create custom visuals for effective data presentation.
Pros
- Easy integration with Google Workspace.
- User-friendly interface for visualization of data.
- Offers pre-built templates and connectors for various data sources.
Cons
- Limited advanced analytics features compared to some other specialized tools.
- The steeper learning curve for more complex data analysis needs.
Pricing
Looker Studio is free, and the paid plan starts from $9 per month.
7. Qlik Sense
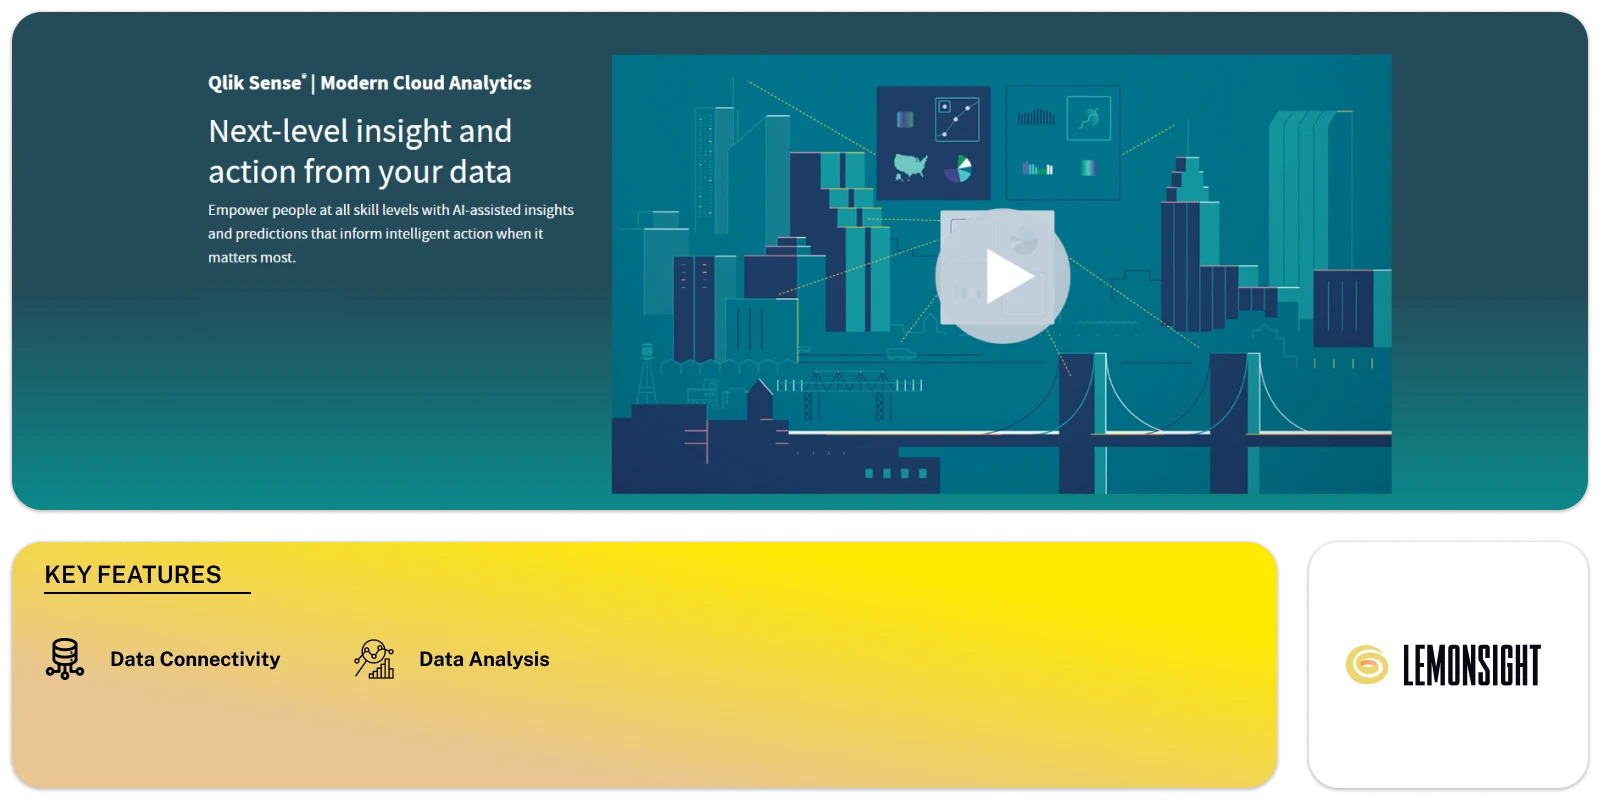
Qlik Sense is a business intelligence and data visualization tool. It allows users to connect to many data sources for effective data analysis, create interactive dashboards, and perform data analysis tasks.
The tool supports various data types, including structured, semi-structured, and unstructured data. It also offers advanced analytics features like data mining, predictive analysis, and storytelling.
Qlik Sense’s Insight Advisor provides valuable analyses and insights. It also automates analytics creation and data preparation processes. It also supports natural language interaction for flexible insights and analytics. Its AutoML feature offers key-driver analysis, predictive analytics, and what-if scenarios.
Key Features
- Data Connectivity : It connects to data sources to create interactive dashboards.
- Data Types : The tool can handle various data types, such as structured or unstructured.
- Data Analysis : It offers advanced analysis functions like data mining and predictive analytics.
User-Specific Benefits
Connect to various data sources and create interactive dashboards. Use advanced analytics and predictive features to uncover valuable insights.
Pros
- Flexible data connectivity and support for different data types.
- Analytics powers for gaining valuable insights.
- Qlik AutoML eases predictive analytics.
Cons
- Needs careful data preparation for accurate analysis.
- Advanced features may overwhelm casual users.
Pricing
Qlik Sense offers pricing plans starting from $20 per month.
8. Domo

Domo is an AI data visualization tool that helps users make informed decisions based on real-time data. It provides intuitive dashboards, reporting, and AI-generated insights. This allows users to understand and act on their business information.
Domo’s custom data views and reporting allow for better and faster decision-making. The tool offers a secure, flexible foundation. It integrates real-time data from various sources, including cloud data warehouses.
Domo simplifies data science pipelines and delivers business insights. It also helps users create low-code and pro-code business apps, as well as automate processes.
Domo fosters a data-driven culture that inspires bold questions and fast action. This makes it a valuable tool for organizations aiming to use data to drive business growth and impact.
Key Features
- Data Visualizations : It helps data to convey insights to users.
- Reporting : Users can simplify, automate, and access business intelligence.
- Analytics : Users can share data and analytics with customers.
- Data Integration : Its flexible data allows real-time data integration.
- Collaboration : Users can collaborate on data analysis, visualization, and decision-making.
User-Specific Benefits
Get real-time insights and intuitive dashboards. Automate reports and create both low-code and pro-code apps. Use AI insights to drive decision-making.
Pros
- It provides real-time data insights.
- The tool offers intuitive visualizations.
- It provides AI insights on a scale.
- It creates low-code and pro-code business apps.
Cons
- It may have a learning curve for new users.
- Continuous updates and integration processes may need carefulness.
Pricing
Domo is free, and the paid plan starts at $300 per month.
Importance of AI in Data Visualization
Artificial Intelligence in data visualization has led to significant advancements. It makes the process easier and quick. Here are some highlighted aspects of why AI is important in visualization.
- Automated Insights
AI tools in data visualization quickly generate insights from your data. They detect trends and patterns that would be hard to spot manually. This boosts business decision-making by providing clear and actionable information. - Enhanced Interactivity
AI enhances how you interact with data graphs and charts. You can easily dive deeper into your data, improving productivity by allowing you to explore data in ways that suit your needs. - Natural Language Processing
AI tools often use natural language to interact with you. You can ask questions or give commands in plain English. This feature makes presentations more intuitive and helps you get the answers you need quickly. - Predictive Analytics
AI tools can forecast future trends based on historical data. This capability is valuable for making informed decisions and planning strategies in advance. It boosts your data analytics by providing insights into what might happen next. - Complex Data Handling
These tools manage large and complex datasets with ease. They convert massive amounts of information into understandable formats. This ensures that you can handle your data efficiently and make better decisions.
What features to look for in an AI-Powered Data Visualization tools?
When choosing AI visualization tools, focus on features that enhance your workflow. These features not only streamline the process but also ensure you gain valuable insights from your data.
Natural Language Processing (NLP) allows you to interact with data in plain language. You can ask questions or give commands, and the tool responds with relevant visualizations. This feature makes it easy to understand complex data without technical knowledge.
Look for tools with AI Anomaly Detection. These help you spot trends or outliers in your data. By automatically identifying important patterns, these features save you time and help you make informed decisions.
Consider how the tool fits into your existing setup. The best AI business tools will integrate seamlessly with your other software. They should also support collaboration, allowing you to share insights effortlessly across teams.
AI Productivity tools often include automation features. These tools can handle repetitive tasks like data preparation and report generation, freeing up your time for more strategic work.
Finally, if your work involves presenting data, opt for tools that double as presentation generators. They should enable you to create polished visuals directly from your data, making it easier to communicate your findings to others.
Focusing on these features will help you find a visualization tool that enhances your productivity, improves decision-making, and integrates well with your existing tools.
Final Thoughts
Artificial intelligence in data visualization has made a great impact. It aids in deriving meaningful insights in minutes, making the process effortless. Such AI-powered tools have changed how we represent data and gain insights for good.
These tools allow quicker and better decision-making, helping businesses in the process. They provide a deeper understanding of the data, allowing businesses to use their data information to the full extent.
As technology is evolving, these tools will likely continue to evolve. In the future, they will provide more sophisticated features and ease of use in AI visualization.
Facebook
Twitter
Telegram
Faq’s
Is there AI for data visualization?
Yes, AI tools enhance visualization by automating the creation and interpretation of visual data.
Which tool is best for data visualization?
The best tool depends on your needs. For example, Tableau is great for personalized insights, while Power BI is ideal for Microsoft integration.
Is there an AI tool for data analysis?
Yes, many AI tools like Sisense and Qlik Sense offer powerful data analysis alongside visualization.
How to use AI for Data Visualization?
You can use AI tools to automate the process, generate insights, and create interactive dashboards from complex data.
Can AI do Data Visualization?
Yes, AI can create visualizations and enhance them with predictive insights and automated explanations.
How does data visualization improve AI development?
Data visualization helps understand patterns, identify trends, and optimize AI models by providing clear visual feedback.
How is AI used in data visualization?
AI automates chart creation, interprets data patterns, and provides predictive analysis, making visualization more intuitive.
Which tool is most used for data visualization?
Tools like Tableau, Power BI, and Looker Studio are widely used for their robust visualization capabilities.
Yes, AI tools enhance visualization by automating the creation and interpretation of visual data.
The best tool depends on your needs. For example, Tableau is great for personalized insights, while Power BI is ideal for Microsoft integration.
Yes, many AI tools like Sisense and Qlik Sense offer powerful data analysis alongside visualization.
You can use AI tools to automate the process, generate insights, and create interactive dashboards from complex data.
Yes, AI can create visualizations and enhance them with predictive insights and automated explanations.
Data visualization helps understand patterns, identify trends, and optimize AI models by providing clear visual feedback.
AI automates chart creation, interprets data patterns, and provides predictive analysis, making visualization more intuitive.
Tools like Tableau, Power BI, and Looker Studio are widely used for their robust visualization capabilities.


